Background
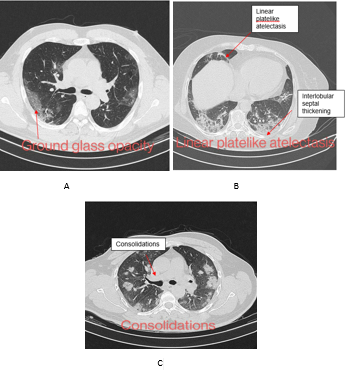
At the point of writing this manuscript, coronavirus 2019 (COVID-19) has infected around 220 million patients with 4.55 million deaths worldwide with third wave of COVID-19 being imminent in India. Detection of the antigen by reverse transcriptase polymerase chain reaction (RT-PCR) on the nasopharyngeal swabs has been the gold standard for diagnosis albeit sensitivity reported between 30 and 80%.1, 2 Computed tomography (CT) of the chest is an invaluable tool assisting the diagnosis in patients with high risk of suspicion but negative by laboratory tests. In addition to the diagnosis, CT chest is versatile tool in prognosticating complications like post covid fibrotic lung disease and guide the management accordingly.3, 4 The most common findings on CT scan include peripheral ground-glass opacities and consolidations as well as linear plate like atelectasis, interlobular septal thickening and reticulations.5 Findings similar to COVID-19 can also be observed in CT with other diseases such as non-COVID viral pneumonia, like SARS, MERS, Influenza Virus.6 Many Studies have explored CT scoring systems in differentiating the chest findings in COVID-19 from other diseases as well as in disease severity (mild/moderate/severe), and in prognostic stratification.7 BhaktiVedanta Hospital and Research Institute is a 200 bedded hospital in Mumbai India and has been actively treating COVID-19 patients of any severity. We have developed a scoring system for severity classification and prognostic identification of COVID-19 patients. In the present study, we evaluated the usefulness of high resolution computed tomography guided anatomico-pathological scoring system for stratifying and prognosticating pulmonary manifestations of COVID-198 which will be invaluable in triaging the severity of the disease.
Materials and Methods
Study design and ethics
This study was carried out after obtaining approval from the Institutional Ethics Committee (approved by Ministry of Health, Government of India - EC/NEW/INST/2019/245). The study was carried out between May 2020 and Dec 2021 as a single centre, assessor blinded. Written informed consent was obtained from the study participants. CT scans were performed to the study participants as a part of standard of care and not for this study purpose. We adhered to the latest Declaration of Helsinki guidelines, New Drug Clinical Trials - 2019 guidelines (India) and ICMR - 2017 guidelines for conducting biomedical research in India.
Study participants
Adults (>18 years) of either gender with symptoms of COVID-19 disease with RTPCR confirmed infection and have undergone high-resolution computed tomography tests were recruited after their consent. Patient having pulmonary malignancy, tuberculosis, previously detected interstitial lung disease, pleural effusion were excluded from the study. Patients with very minimal clinical symptoms and no opacities in lung parenchyma on CT scan were also excluded from the study. We classified the severity of COVID-19 infections as follows: mild, moderate, and severe based on 'Clinical management of COVID-19' version 3, dated 23rd Nov 2021 published on 23rd Nov 2021. Patients without dyspnea and respiratory rate less than 24/min and oxygen saturation by pulse oximetry (SpO2) ≥ 94% on room air were classified as ‘mild’; those with moderate dyspnea and difficulty in breathing, with respiratory rate between 24 and 30 per minute, and SpO2 of 90-93% on room air were considered ‘moderate’; and those experiencing severe shortness of breath and difficulty in breathing, respiratory rate > 30/minute and SpO2 less than 90% on room air were considered to have ‘severe’ COVID-19 disease.
Assessment of score
The chest CT severity score was devised, and its face validity was confirmed following the consensus from internal medicine specialists, infectious disease specialists, and radiologists working in our hospital. This scoring system consisted of following items: ground glass opacity (GGO), consolidations, linear atelectatic and reticular opacities. [Figure 1A - C] The lung was divided into 18 segments as per the anatomico-physiological division and accordingly the scoring was provided assuming the lung parenchymal opacities and their densities being directly proportional to the severity of the disease. In a given segment, a GGO was given a score of 2, consolidation was given score of 4 and atelectasis/reticular opacities were given the score of 6 [Table 1]. The reliability of the scoring system was established in 15 patients who were not involved in the main study. This is a compound scoring system (GCA) consisting of GC (ground-glass opacity and consolidation) score (maximum = 108; maximum G score is 18 X 2 =36, maximum C score 18X4=72) related to severity and A score (maximum = 108; 18X6=108) determining the prognosis of the disease. The final score was the addition of the two scores (maximum = 216). The severity score was based on the extent of lung involvement and each segment was evaluated and were considered as mild (<36), moderate (37 to 72) and severe (73 to 108) based on their G and C scores. To minimize error and to enhance accuracy each CT assessment was done by two radiologists independently. Physician independently evaluated the patients’ records for severity assessment (based on COVID-19 disease severity scale developed by world health organization).
Table 1
Prototype for GCA scoring system. GGO: 2, Consolidation : 4, Atelectasis / linear platelike bands : 6 Mild < 36 , Moderate > 36 to < 72 , Severe > 72
Table 2
Demographic characteristics of the study participants (N = 500)
CT scan Parameters
CT scans were performed using by 16 detector siemens somatom scope power CT scan machine. Patient lied down in the supine position and with an inspiratory breath hold the CT images were acquired caudo-cranially covering the entire lung parenchyma from apex up to the costophrenic angle. The CT scan parameters that were used: At a pitch of 1.0, and with automatic care dose system from siemens the appropriate KVP and Mas were selected. Slice thickness was 5 mm with inter slice gap of 5 mm. The acquired images were than reconstructed in axial, coronal and sagittal planes with 1.5 mm thickness.
Statistical Analysis
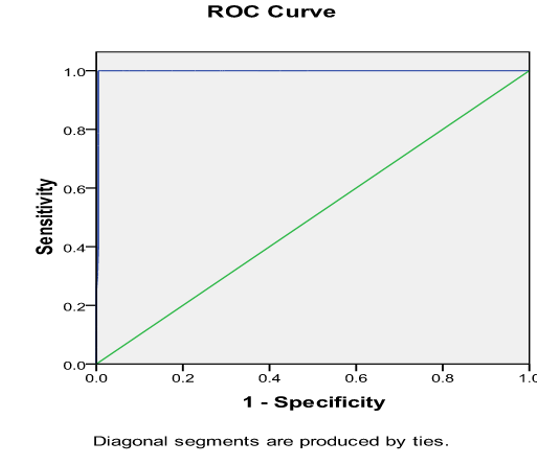
Descriptive statistics was used for representing the demographic characteristics. Chi-square test for association was used for analysing the categorical variables. Mann-Whitney U test was used for analysing the scores between the groups. Receiver-operating characteristics (ROC) curve was plotted for evaluation of the area under the curve, sensitivity, specificity, positive predictive value (PPV), and negative predictive value (NPV). A sample size of 500 was attained with the assumed sensitivity and specificity of 0.8 each and 95% accuracy. SPSS version 26 was used for statistical analysis and a p-value of < 0.05 was considered significant.
Results
Demographics and segment involvement
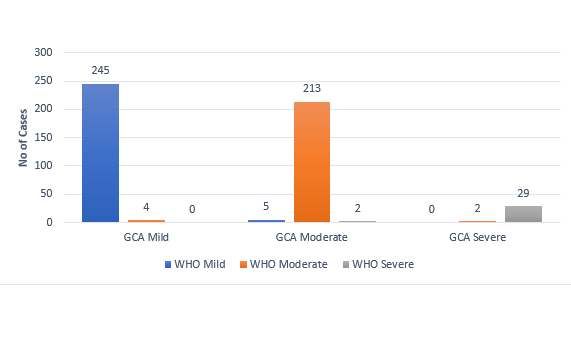
Five hundred patients were recruited of which 249 had mild, 220 with moderate, and 31 had severe COVID-19 disease. Individual demographic characteristics of the study participants are listed in Table 2.
Most involved segments were superior (65%), lateral basal (56%) and posterior basal segments (64%) of right lower lobe and anteromedial (62%) and posterior basal segments(57%) of left lower lobe.
Patchy non-confluent peripheral ground-glass opacities with apicobasal gradient is the most common finding (47%) in mild cases. Bilateral lower lobes were most commonly involved (72%).
In moderate cases ground-glass opacities with consolidation is the predominant finding (82%).
In severe cases ground-glass opacity, consolidation as well as linear platelike atelectasis and reticular opacities may represent with apicobasal gradient (80%).
GCA scores
Four-hundred and ninety-two (98.4%) patients showed GGO, 280 (56%) showed consolidation and 244 (48.8%) had atelectasis. The median (IQR) range of scores for GGO was 26 (14-33.5), consolidation, it was 0 (0-12) and atelectasis – 12 (0-36).
Comparisons of GCA score with WHO COVID-19 disease severity scale
There were 80 Patients with atelectasis score more than 54. Almost perfect agreement was observed in the severity states obtained by GCA scores compared with WHO COVID-19 disease severity scale (accuracy was 97.4%) (Figure 2). ROC curve revealed that the area under the curve of 0.997 with a score of 53.5 observed as a cut-off value for poor prognosis with 100% sensitivity and 99.99% specificity, PPV = 97.2% and NPV = 100% (Figure 3). Those with poor prognosis had a significantly greater fibrosis scores compared to those with good prognosis [66.7 (15.1) vs. 13.1 (16.7); p < 0.0001].
Discussion
We recruited 500 adults with RT-PCR confirmed COVID-19 disease of various severity who underwent CT chest where indigenous GCA score that was primarily based on GGO, consolidation and atelectasis was evaluated.9
While CT scan has already established itself as an important diagnostic tool, a good scoring system should help us to further enhance our ability to stratify the severity of disease burden and to prognosticate the sinister sequelae of covid19 pneumonia like post covid fibrotic lung disease.10 The GCA scores in the present study were significantly associated with the severity states of COVID-19 disease.11, 12
Recently in Dutch, COVID-19 Reporting, and Data System (CO-RADS) was devised that comprises clinical findings with the laboratory test results along with CT findings.13
The first CT severity scoring system was developed by Fancone et al. in who used pulmonary parenchymal opacities on CT scan as surrogate method for scoring the severity of the covid-19 pneumonia.14 This system of scoring divides the lung into five anatomical lobes and each lobe is given score according to its percentage of involvement from the scale of 0 to 5. This scoring system didn’t consider anatomico-pathological segment wise disease burden. To improve this, Ran Yang et al. developed a furthermore detailed scoring system in.15 They divided the lung into 20 parts namely, 18 segments of the lung while the apico posterior segment of left upper lobe was further divided into apical and posterior parts; and the anteromedial segment of left lower lobe was divided further into anterior and medial part. However, this system of scoring did not consider the differences in the severity states of ground glass opacities, consolidation and atelectasis separately which even though in a state of the continuum have distinct radiological appearances and signify increasing severity of the disease.
We created an in house CT-Scan scoring system based on the awareness of an inflammatory involvement of the lung beginning with typical peripheral GGO pattern intensifying into a more dense looking consolidation phase followed by subsequent atelectasis of the alveolar lobule which is seen as linear plate-like reticular pattern. Thus a G-Score (For GGO), C-Score (for consolidation) and A-Score (For atelectasis) was formulated for each of the 18 segments of the lung and added to give a total, what is called as GCA Score.
Furthermore, to the best of our knowledge, none of the published scoring systems have considered differential severity of ground-glass opacity and consolidation and none have given importance to atelectasis or linear opacities for prognostication of post COVID fibrotic lung disease. Considering the above limitations, we have developed a novel COVID-19 pneumonia scoring system which not only addresses detailed anatomical distribution of disease burden and stratifies disease severity but more importantly also incorporates pathophysiological state of the disease.
In the normal Physiology of body the cytokine levels are well regulated by positive and negative feedback system. When sars-cov-2 Virus enters the body it unhindered it triggers overreaction of innate and adaptive immune systems causing increased amounts of cytokines to be released with lymphocyte activation.
The process of lung injury is labelled as GGO when pulmonary arterial radicles are visible through the opacities and as the inflammation mounts further GGO progresses into next higher stage of severity which is appreciated on CT scan as consolidation.
As inflammatory exudates becomes more dense causing more severe damage to pulmonary parenchyma, it results in subsegmental collapse which is appreciated on CT scan as linear /platelike atelectasis or parenchymal bands.
These atelectatic changes can further progress into irreversible fibrosis or may regress back to normal alveolar architecture.
We divided the lung into 18 anatomical-physiological segments. Based on above rationale, each segment was given a score of 2 if ground-glass opacity was present, a score of 4 if consolidation was present and a score of 6 if linear plate like atelectasis or linear bands were present. The patient was classified as having mild disease if its combined score of ground-glass opacity and consolidation was less than 36, moderate if its combined score of ground-glass opacity and consolidation was more than 36 but less than 72 and severe category if the score was more than 72. The atelectasis score on the other hand suggested a high likelihood of developing post COVID fibrotic lung disease if the score exceeds 54. While our scoring system matched accurately with WHO COVID-19 disease severity scale, our system had the added advantage of offering a more detailed segmental and anatomical distribution along with a fairly accurate prognostication(with 100% sensitivity and 99.99% specificity, PPV = 97.2% and NPV = 100%.). This certainly translates as beneficial to the clinician in stratifying the severity, prognosticating long term sequelae and devising appropriate treatment strategies.
Conclusion
HRCT Chest has certainly come up as a versatile aid for our war against COVID -19. It not only diagnoses the disease in its early stage but also stratifies the disease burden when complimented with a good scoring system like the one which the authors have presented, This versatile tool also identifies and prognosticates sinister sequelae like post covid fibrotic lung disease.
As the human civilisation reels under the all devouring corona pandemic, the HRCT chest has emerged as a great aid-de-camp not only in identifying but when complemented with the GCA scoring system (elaborated in paper) in stratifying disease severity and the therapeutic option thereof along with prognosticating sinister post-covid sequalae.


