Background
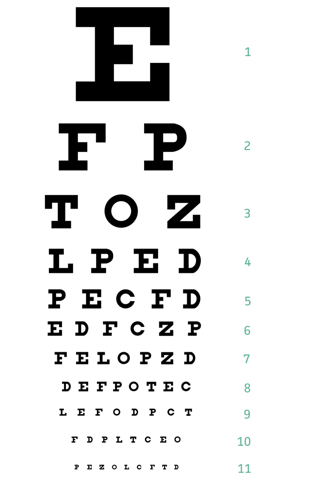
The use of a visual acuity assessment, in the form of a Snellen Chart (Figure 1), is considered to be a first line comprehensive tool that is widely utilized across healthcare professional services.1 A Snellen Chart is designed as an easily accessible and portable tool to assess monocular and binocular visual acuity using a letter-based scale at a distance of 6 metres or 20 feet.2 A Snellen Chart is read by assessing the patient’s vision as a relative ratio of “standard” performance.3 As an example, 20/20 vision would imply that the patient is able to see at 20 feet what the relative standard person would see at 20 feet. Similarly, 20/40 vision would imply that a what a patient can see at 20 feet, people with “standard” vision would be able to see at 40 feet – therefore implying visual impairment. A patient should be tested with one eye at a time at the standard distance for the chart with their regular prescription glasses on, if there is any disparity, they should also be tested using a pinhole to correct for refractory error.1
Utilizing a Snellen Chart can help a practitioner determine a patient’s clarity of vision (i.e the visual acuity) and screen for any concerns with suboptimal visual function, leading to potential irreversible visual loss.4 In so doing, this initial screening assessment provides them with relevant information to support diagnostic, remedial and interventional procedures required. Primary eye care is an essential part of wholistic visual care to optimize end outcomes by playing the role of the first point of call. Appropriate intervention following a thorough screening at primary care level not only prevents long term blindness but also notably reduces ocular morbidity.
The results of a visual acuity assessment, coupled with the overall clinical presentation, may help guide the appropriateness of referral to secondary care services for remedial or adjunctive treatment when considering the needs of a patient.5 Despite its many benefits within the screening process, there has been a concern about the frequency of this assessment being used by primary care practitioners to refer patients onwards. A potential consequence of incomplete referrals being made can lead to a significant impact upon an individual’s care and health outcomes as well as minimize safety protocols during the transition from primary care to secondary services. Further to this, due to delays in managing the severity of initial presentation, there is the potential for increased demand and workload for specialist clinicians, which can lead to delays for the patients care pathway.
Aims and Standards
Visual acuity tests can often be a disregarded part of clinical assessments of patients with visual problems in acute or outpatient settings.4 As a standard practice, it is essential for patients with acute visual concerns to have a documented visual acuity assessment.6
Our aim within this audit, is to evaluate the prevalence of conducted visual acuity assessments in patients with acute visual concerns within the primary care settings, focusing on general practice, made and handed over at the time of referral (done primarily via telephone) to our regional ophthalmology service.
Materials and Methods
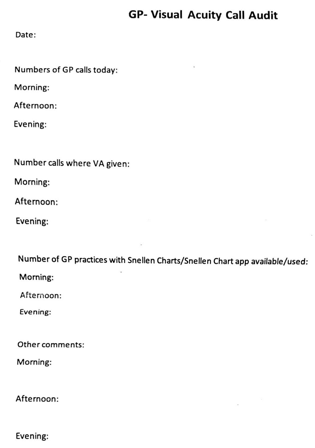
During a seven-day period, prospective data was collected from primary care services undertaking referrals via a regional referral phone. A questionnaire (Figure 2) was devised for data collectors to record information such as the number of GP/primary care calls within an eleven-hour shift, the number of times a visual acuity (VA) assessment was done by the referring clinician and included as part of the referral and if the facility had a Snellen Chart to use (paper or online version). There was an area for additional comments/information to be provided by the referring clinicians.
The following rating has been applied to the results to determine and highlight any areas of concern following audit completion:
The referring clinician has undertaken a visual acuity assessment and has a Snellen chart available with their practice for calls undertaken on a specific day (100% outcome).
The referring clinician has not undertaken a visual acuity assessment and does not have access to a Snellen Chart prior to referring to the ophthalmology service on a specific day (less than 100%).
Results
Table 0
|
Day |
GP Referral Calls |
VA done |
Snellen Chart Available |
|
1 |
4 |
1 |
1 |
|
2 |
2 |
2 |
2 |
|
3 |
2 |
0 |
0 |
|
4 |
2 |
1 |
1 |
|
5 |
1 |
0 |
0 |
|
6 |
2 |
2 |
2 |
|
7 |
4 |
2 |
2 |
When reviewing the results which have been tabled above, there are several trends that have been highlighted. Firstly, there has been 17 GP referrals made from across the Northeast Region to specialist ophthalmology services over a seven-day period. Secondly, the visual acuity assessment has been completed in less than half (only approximately 47%) of GP assessments for patients suffering from an eye-related illnesses or injury. Thirdly, it has been noted that 47% of primary care services have had access to a Snellen chart to complete a comprehensive and detail-oriented assessment. Within the questionnaires received from GP services, it has noted in additional comments that the HP’S did not have access to Snellen Chart facilities when asked.
Recommendations
After reviewing the above results, there are several recommendations that can be made to improve the assessment process and bridge the gap between community and secondary care referrals:
Firstly, from the data above, it can clearly be seen that there is a lack of inclusion of objective visual acuity assessments when referring to secondary care services, increasing the risks of both missed significant diagnoses and inappropriate referrals. When asked about factors that prevented general practitioners from performing a visual acuity assessment, it seems the major limiting factor from subjective response was lack of access to a Snellen Chart.
Due to the importance of having access to this tool to conduct this essential and basic assessment, we have since looked into several different ways that Snellen Charts can be accessed to prevent this from limiting the performance of this examination. The first resource to access Snellen Charts would be to purchase one from an approved medical source online or in store. This would offer the benefit of a standardized fitted chart in a physical format. The second option would be to print a chart available from sources online- several charts are available to print when using a search engine, including some available on optometry websites. When printing such charts, it is important to note the paper size and dimensions to suit the relative distance the vision is being tested over. The last option consists of downloading one of several now available visual acuity testing apps online- many of which can be downloaded for free. Although there is no single universally accredited app, they can be found from widely used reliable sources such as MDCalc (Figure 1). Additionally, they are quite user friendly and portable options that have letters configured to adjust to phone screen sizes at an arms’ length or more distance. Studies have shown that using app-based testing modalities can yield a similar degree of correlation to results achieved by physical charts.7
Limitations
Whilst we were able to collect data from referrals coming in from across the region, we would have preferred to have an increased number of calls to be able to further optimize the reliability and validity of our data. We would also have liked to expand this between more regions across the country to be able to assess if there were any discrepancies between regions and their respective limiting factors.
Action Plan and Re-audit
As per the results of this audit, there is a lack of access to the appropriate tool to undertake a visual acuity assessment from a primary care service perspective. The aim for to improve the prevalence of visual acuity assessments within secondary referrals would involve the imperative step to inform GP surgery’s/primary care centres of where to obtain a Snellen Chart and promote their use through sufficient access and training. As this is considered to be a new baseline audit, we are aiming to disseminate information regarding the importance of conducting visual acuity assessments and where to access the related tools around the GP and primary care centres within our region and re-audit these parameters in 6-12 months’ time with an aim to increase awareness of the importance and the prevalence of Snellen Chart based visual acuity assessments.


